We’ve all watched the jaw-dropping jet-boating adventures of Ollie Sharpe on Instagram (@olliesjetboating). Boating inland is a whole different experience from the saltwater cruising many Kiwis know. Inland rivers aren’t ruled by tides but by rainfall and snowmelt, which can transform a calm run into a torrent overnight. Shifting channels, gravel bars, and shallow stretches demand purpose-built craft — and that’s where jet boats and shallow-draft hulls truly come into their own on New Zealand’s braided rivers.
North Island boaties might not realise that Environment Canterbury (ECan) operates one of the most comprehensive river-monitoring systems in New Zealand. The public Canterbury riverflow data portal lists over 160 river and lake sites, with live readings of flow, stage height, and water temperature.
Each point on the map represents a telemetered gauging station, quietly recording how much water is rushing down rivers like the Rakaia, Waimakariri, and Ahuriri. It’s the same network that underpins flood forecasts, irrigation planning, and hydropower management. For boaters, it’s a free, easy way to gauge river conditions before trailering inland.
What the numbers mean
Click any site and you’ll see a graph charting water level and discharge over time. “Stage height” (in metres) tells you how full the river is. “Flow” (in cubic metres per second) shows the rate of water movement.
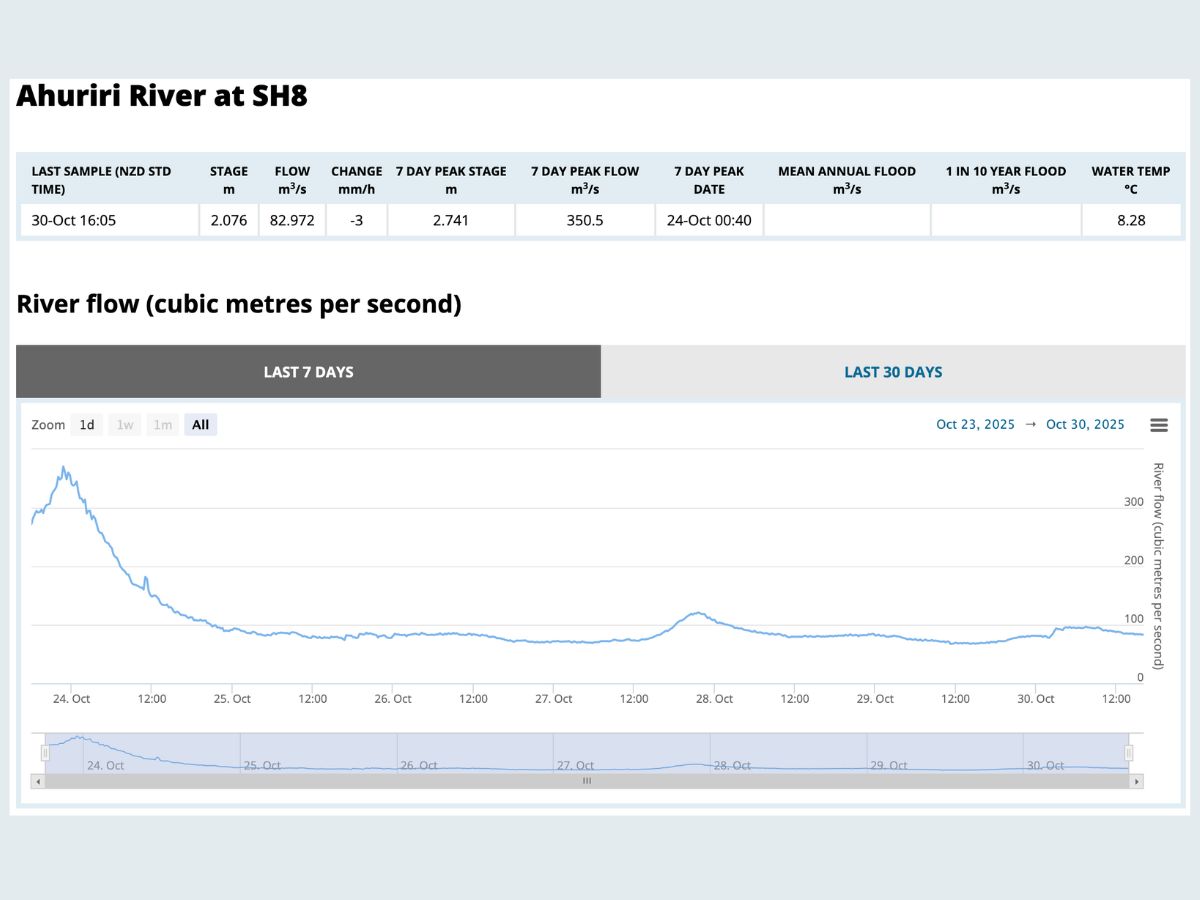
For example, on the Ahuriri River at SH8, a recent spike on 24 October lifted flow to 350 m³/s, the sort of surge that would transform an ordinary boating day into something far riskier. A week later, levels had dropped to a more manageable 80 m³/s.
Each chart also shows whether the river is rising, steady, or falling, using small arrows beside the data. Rising flows signal water on its way downstream, often from rain or snowmelt in the ranges. Falling trends suggest the river is settling, which usually means safer conditions for small craft.

From the screen to the launch ramp
For jet-boaters, kayakers, and anglers, these graphs are invaluable. They help decide whether a trip is on or off. A shallow stage height may mean more gravel bars and rock-dodging; high, fast water brings debris and stronger currents.
Before heading out, check both the flow trend and the time stamp of the last update. The data is collected automatically and sent via radio, satellite, or cellular telemetry. Some sites refresh every few minutes, others less frequently but all provide near real-time insight into what’s happening upstream.
It’s smart to pair ECan’s readings with a MetService rain radar and a look at local webcams if available. That combination gives a complete picture: rainfall coming in, how the catchment is responding, and what you’ll meet at the ramp.
A window into the landscape
Beyond safety, the riverflow data is a fascinating glimpse into the natural pulse of Canterbury. You can see the daily melt cycle on alpine rivers, the delayed surges after heavy nor’west rain, and the quiet flat-lines of drought. The more you study the patterns, the more you understand how the region breathes.
ECan warns that the figures are “raw data only”, meaning they haven’t yet been checked or corrected but they’re still the best early indication of what’s really happening in our rivers.