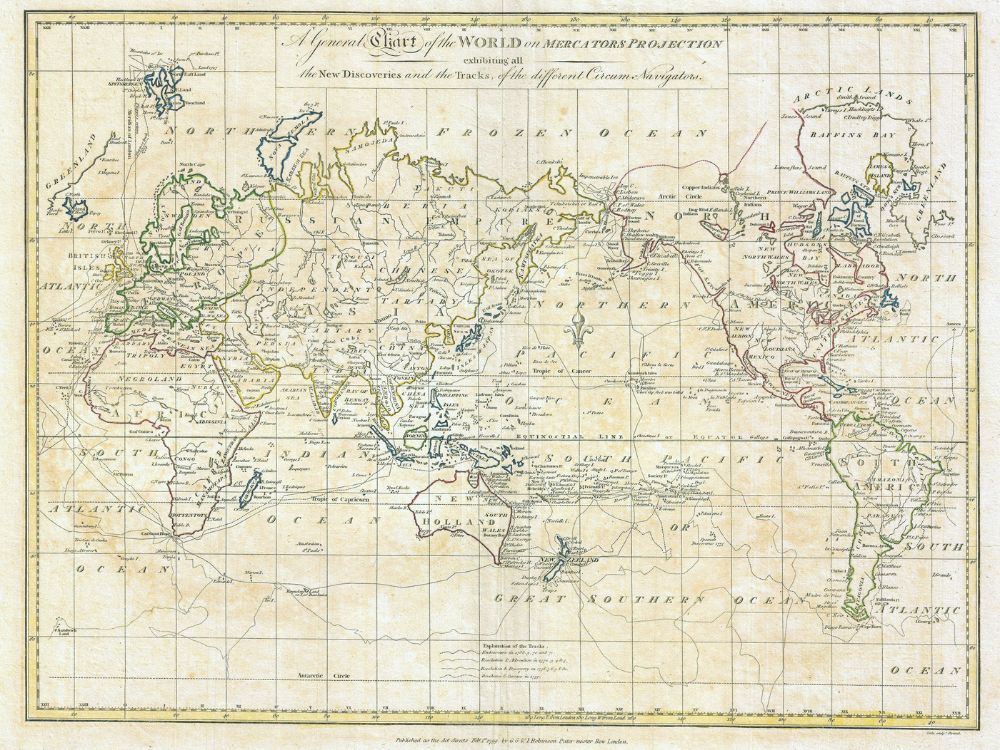
From around the middle of the 18th century, marine charts start to look more familiar to modern eyes.
The transformation of marine charting from commercial art into an exact science began in the 18th century, driven by a simple and urgent truth: imprecise charts killed people, sank ships, and destroyed profits.


Enter Captain James Cook…
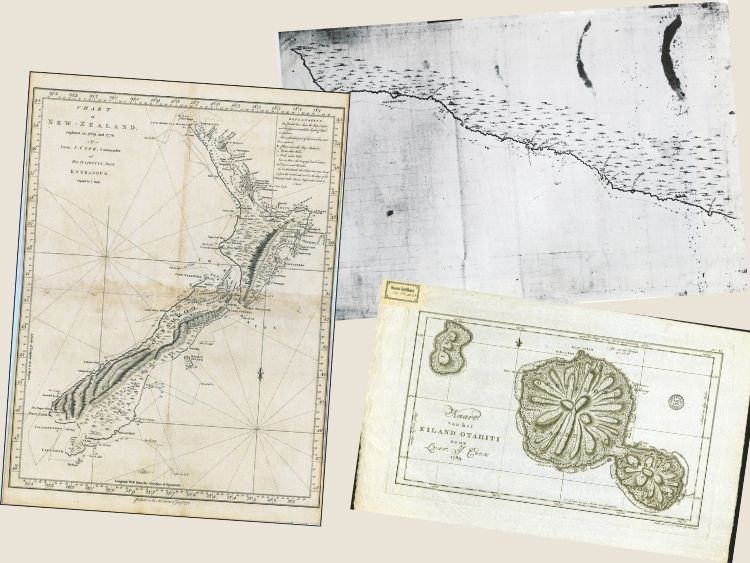
Captain Cook, working first on the treacherous coasts of Newfoundland in the 1760s before his celebrated voyages to our part of the world, defined what a marine survey should actually look like. He took exhaustive soundings, made repeated astronomical observations to fix his positions, and cross-checked his measurements obsessively before committing them to paper. His charts of Aotearoa, eastern Australia, and the Pacific Island groups were so accurate that they remained in operational use well into the 19th century – a remarkable tribute to the patience and precision of the man and his crews.
The miracle of the chronometer
Around this time, the marine chronometer, perfected by Yorkshire clockmaker John Harrison, was formally recognised by the Board of Longitude in 1773. Before Harrison, longitude at sea was estimated by dead reckoning – a compound of speed, heading, and elapsed time that increased errors with every passing day. The chronometer however, allowed a navigator to compare local noon with the time at a known meridian, translating the difference directly into degrees of longitude.
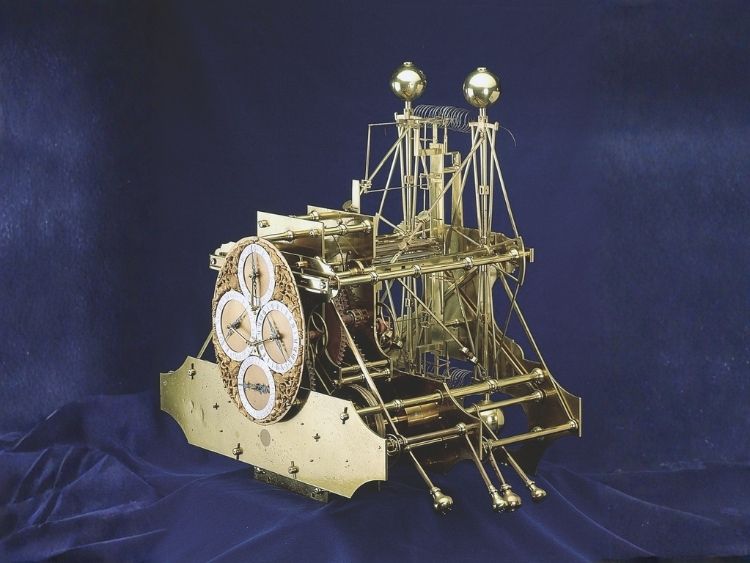
For the first time, the coordinates printed on a chart corresponded to coordinates a navigator could actually measure. The era of systematic, trustworthy charting could begin.

The Admiralty and the age of institutional survey
The 19th century was dominated by the great hydrographic offices, above all Britain’s Admiralty Hydrographic Office, established in 1795. The Admiralty Chart became the closest thing the maritime world had to a universal standard – dense with soundings, clear in its symbology, continuously revised as new surveys came in from the far reaches of Empire. Its authority was recognised even by nations that produced their own charts, and foreign pilots routinely preferred Admiralty sheets to domestic alternatives.
France, the United States (whose Coast Survey dated from 1807), Germany, and eventually Japan and Russia all built serious hydrographic institutions, and the gradual harmonisation of charting conventions across these bodies – symbols, depth units, projection standards – made charts from different nations increasingly interoperable.
The technological improvements of the 20th century
The 20th century delivered major transformations in rapid succession. The echo sounder, developed in the 1920s, replaced the hand-cast lead line, providing a continuous acoustic profile of the seabed.
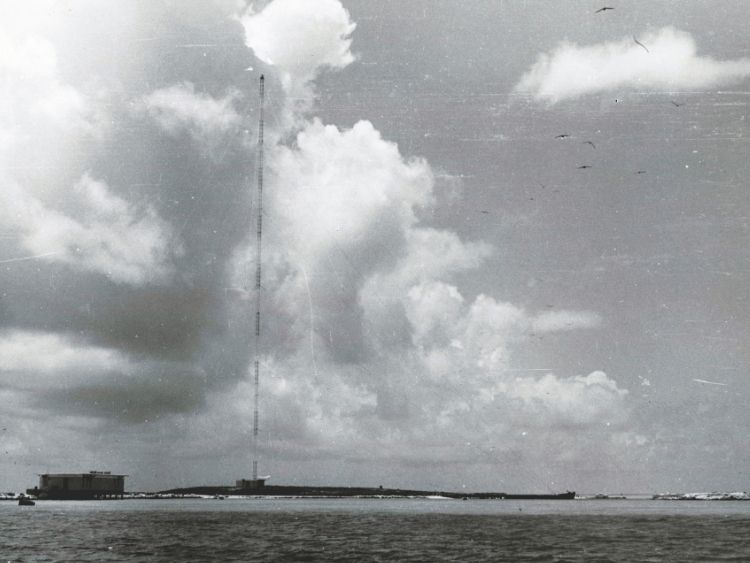
The arrival of LORAN (LOng RAnge Navigation – a radio navigation system developed by the USA during WWII), was initially designed and used to guide shipping convoys across the Atlantic Ocean. By the end of WWII, there were 72 operational LORAN stations providing navigation to over 30% of the globe.
| However, the game-changing system we are most familiar with – GPS – was developed in the 1980s… |
Initially aerial, and later satellite, photography also transformed coastal and shallow-water surveys. Features that had taken months to measure from small boats could be captured and rectified in hours.
However, the game-changing system we are most familiar with – GPS – was developed in the 1980s and gave every vessel on earth positional accuracy measured in metres. This astounding new technology very quickly made obsolete the elaborate process of celestial navigation that had underpinned surveying for centuries.
The digital present
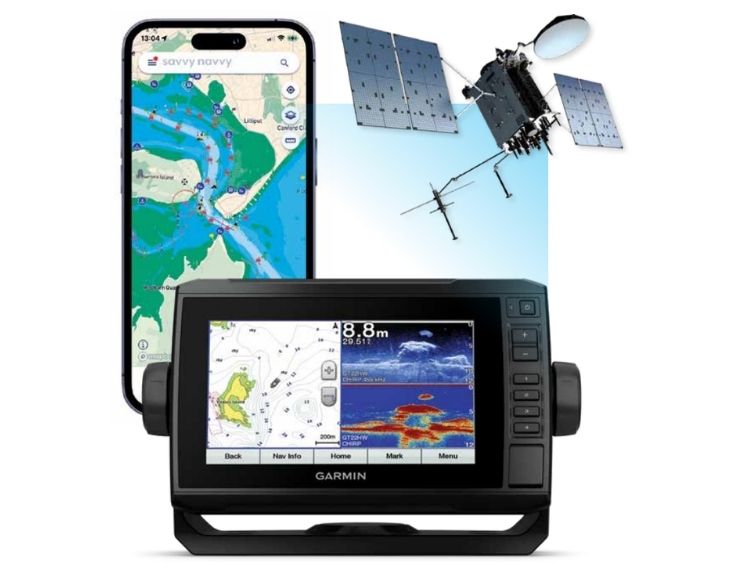
Electronic Chart Display and Information Systems – ECDIS – moved from the experimental phase in the 1990s, to becoming the primary navigation tool on most commercial shipping, mandatory on large vessels under SOLAS regulations since 2012.
Modern marine chart plotters combine GPS, digital cartography, and sonar into centralised Multi-Function Displays (MFDs). They enhance on-water situational awareness with features like live depth contours, radar integration, and real-time route optimisation. Today’s setups offer fast processing, high-resolution IPS displays, and remote tablet mirroring.
It’s amazing how far we have come in terms of technology to map the sea, ensuring safe, profitable and pleasant journeys around both our local bay, as well as around the world.
Next time: Underwater breathing apparatus.