Welcome to ‘A Very Brief History Of…’ researching the history of everyday marine technology, innovation and events Kiwi boaties love (or loathe).
From ancient sailing to today
Charts have been important to mariners for millennia, but they haven’t always been in the form we recognise today.
Growing up around boats, I was always fascinated by marine charts. Visiting boat shops and second-hand dealers, I found joy in exotic locations, dangerous reefs and incredible deserted bays coming alive before my eyes.
The marine chart, however, didn’t just appear. It was forged over millennia through a combination of desperate necessity, mathematical genius, and the relentless urge to see what lay past the ‘edge’ of the known world.
Māori navigation
Māori ancestors navigated the Pacific using traditional Polynesian wayfinding, relying on deep observation of nature rather than instruments. Key techniques included using a mental star compass (kāpehu whetū) to track stellar rising/setting points, reading ocean swells and currents, tracking wind patterns, and observing bird flight paths, cloud shapes, and water temperature to locate land.
Stick charts
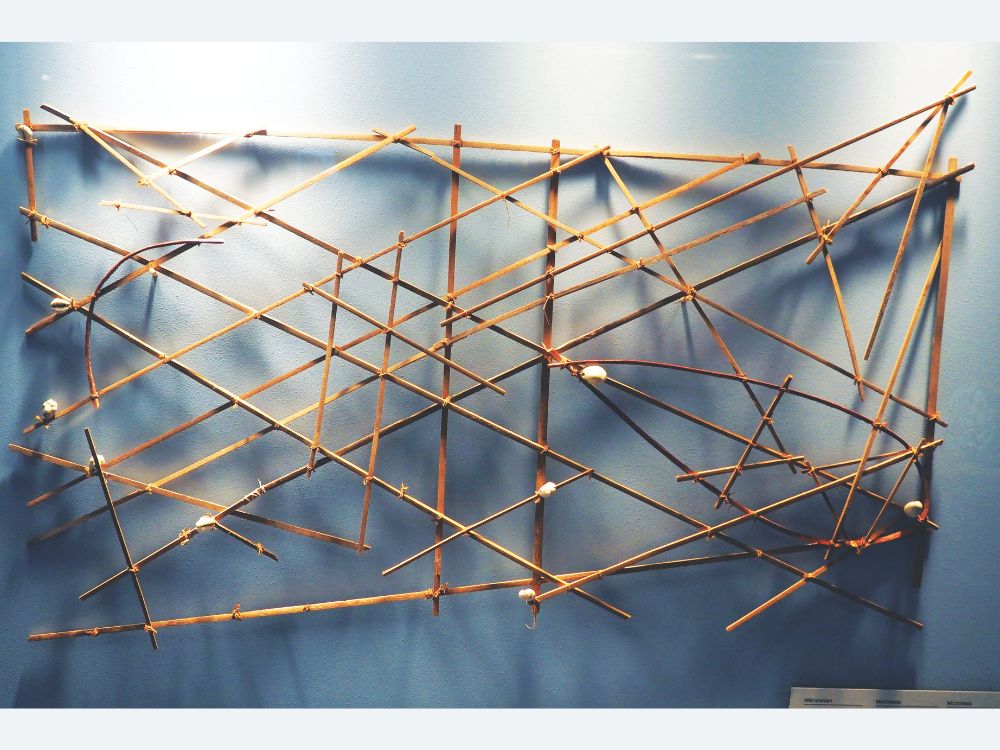
Explorers from the Micronesian Pacific Islands navigated through the use of stick charts, which identified patterns in ocean conditions like swells, waves, and wind. The stick chart was constructed of a wide range of materials including palm ribs, coconut fibre, and shells or coral pebbles. The curved palm ribs represented swells; shells or coral pebbles were used to represent islands. The connections between the sticks showed oceanic patterns such as the direction of swells and how they related to each other, especially around islands.
Era of the ‘Mental Map’ and the Periplus
Early Mediterranean sailors practiced ‘cabotage’ – hugging close to the coast and jumping from landmark to landmark. Their ‘charts’ were often oral traditions or written itineraries known as peripli. The most famous, the Periplus of the Erythraean Sea (circa 1st century AD), detailed the routes from Roman Egypt to India. It provided first-hand navigation, harbour, and trading information for the Red Sea, East Africa, and the Indian Ocean, crucial to understanding ancient trade and economic interaction.
The Portolan Chart
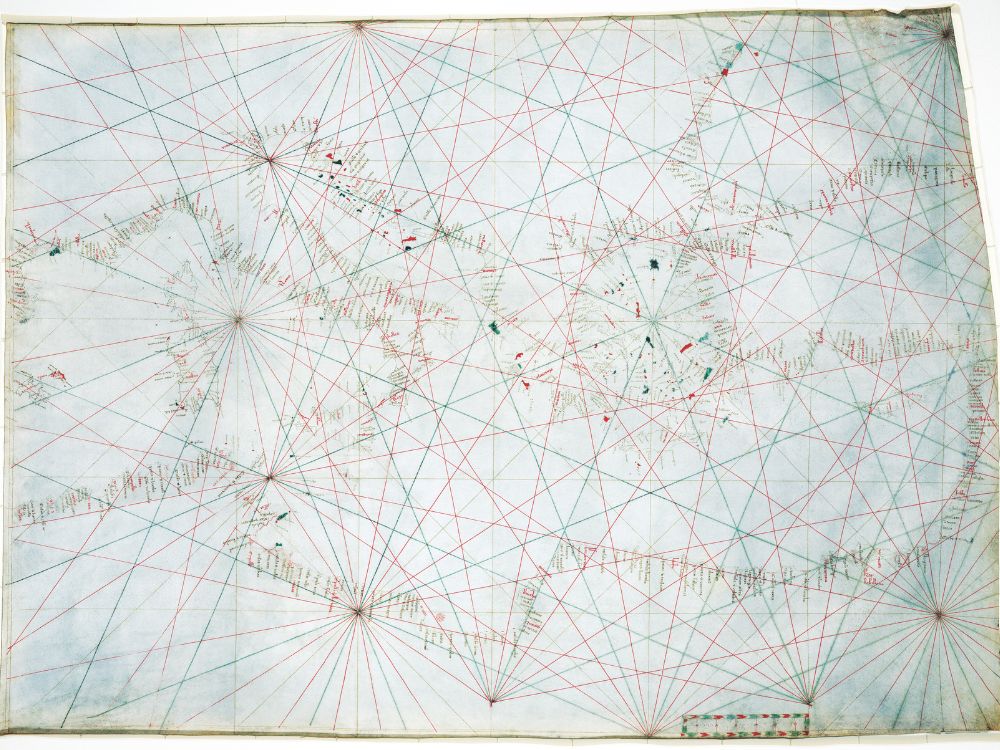
The true ancestor of the modern marine chart appeared in the 13th century: the portolan chart. Named after the Italian portolano (a pilot book), these charts were revolutionary. They were drawn on sheepskin (vellum) and focused almost exclusively on the Mediterranean and Black Seas.

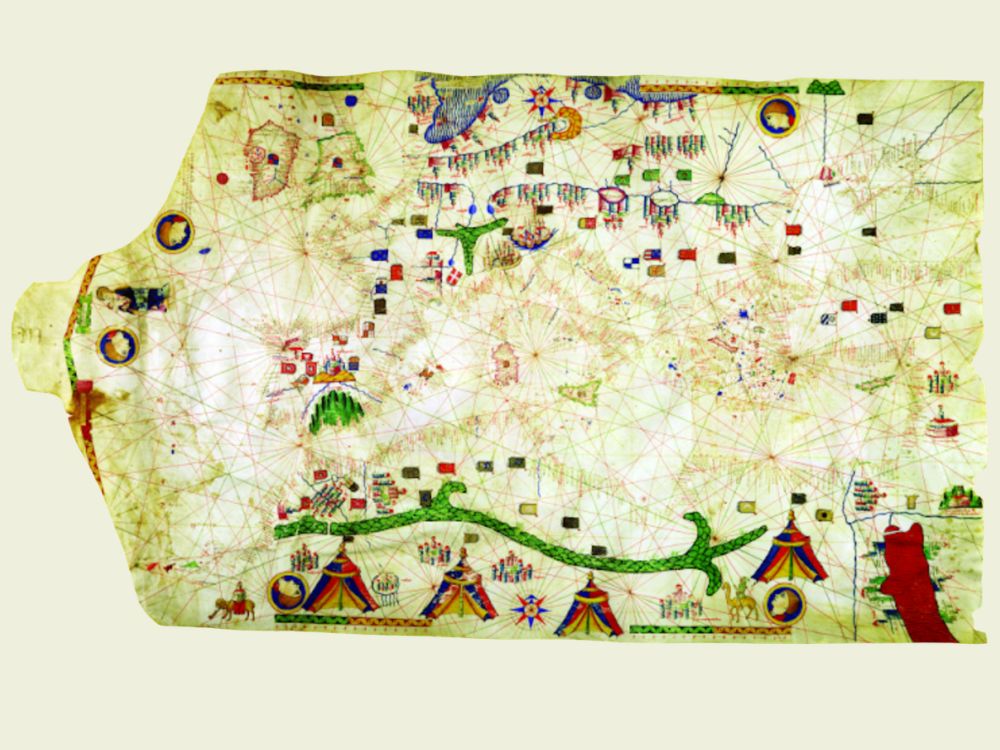
The first thing you notice on a portolan chart is the ‘spider web’ of lines. These are ‘rhumb lines’, radiating from a compass rose. These lines were not meant to show the shortest path, but rather a constant bearing or compass heading for sailors.
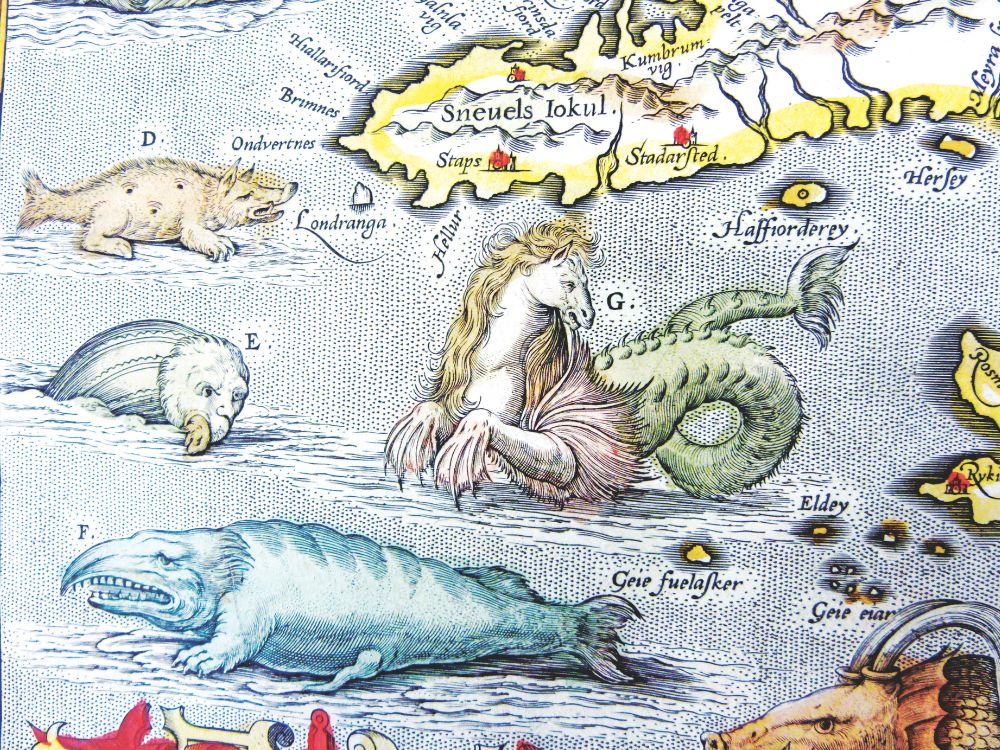
A navigator would find their location, look at their destination, and follow the line that matched his compass bearing. They were remarkably accurate regarding coastal shapes, but sometimes included embellished sea creatures to terrify those brave enough to venture further into the waters.
Mercator’s Masterstroke
By the late 15th century, Europeans were exploring the Atlantic. The Portuguese were rounding the Cape of Good Hope, and Columbus had landed in the Americas. Navigators were suddenly dealing with vast distances where the Earth’s spherical nature could no longer be ignored.
The problem was a mathematical nightmare. How do you represent a 3D sphere on a 2D piece of paper without distorting the directions? If a sailor drew a straight line on a standard map, it wouldn’t actually represent a constant compass course in the real world.
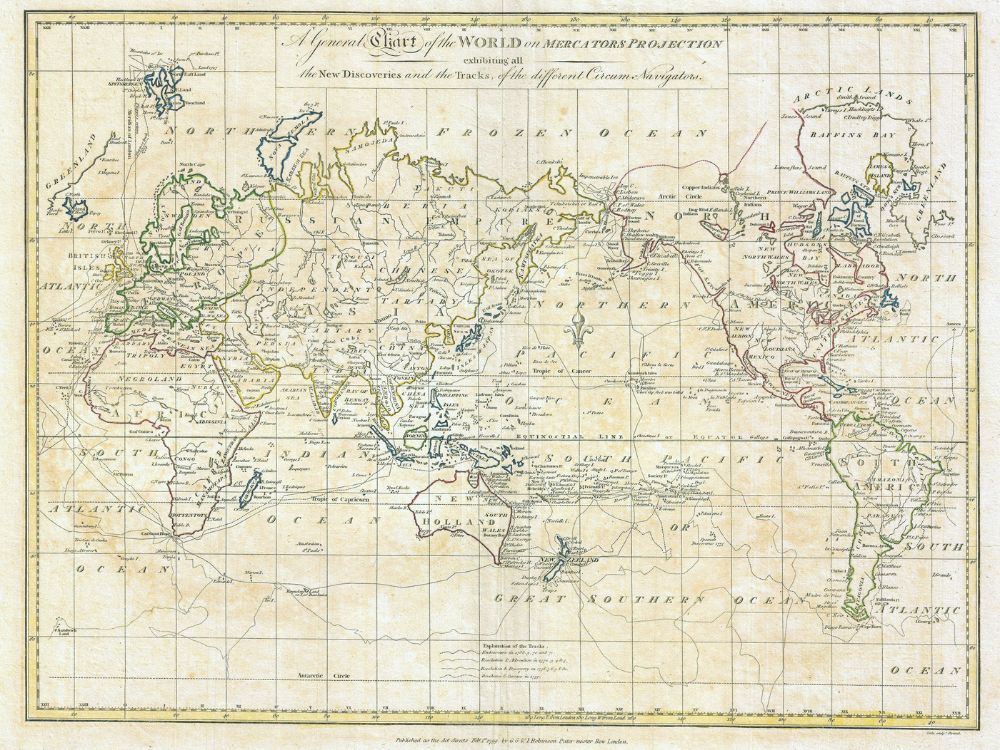
Enter Gerardus Mercator. In 1569, he released his world map, featuring a new projection. Mercator’s idea was to space the parallels of latitude further apart as they moved away from the equator.
On a Mercator chart, a straight line is a ‘loxodrome’ (a line of constant bearing). If you draw a line between two cities, you hold your compass to the dictated degree the entire journey and you will arrive. However these maps were distorted and sacrificed size for the sake of direction.
Trade secrets
Throughout the 17th century, the Dutch East India Company (VOC) treated maritime charts as critical corporate secrets, enforcing strict, often violent, control over the knowledge needed to navigate the Asian spice routes. Ship officers were mandated to sign for all navigation materials, including charts, and were required to return them upon safe arrival home. This was part of a broader, intensely competitive effort to maintain a monopoly on the spice trade and secure immense profits, which amounted to a ‘Secret Atlas’ of maritime routes. BNZ
NEXT TIME: Solving the ‘longitude problem’